Page 60 - Housing Solutions Annual Report
P. 60

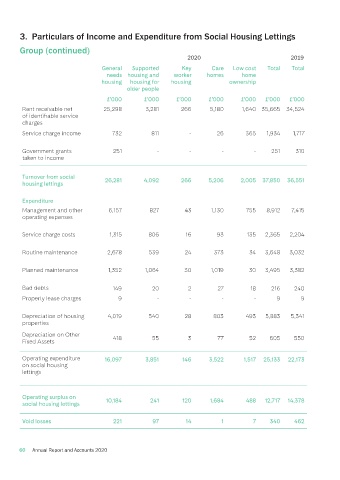
3.    Particulars of Income and Expenditure from Social Housing Lettings
            Group (continued)
                                                                       2020                                2019

                                         General    Supported        Key       Care    Low cost    Total    Total
                                           needs  housing and     worker      homes       home
                                         housing   housing for   housing              ownership
                                                  older people

                                           £’000        £’000      £’000      £’000       £’000   £’000    £’000
             Rent receivable net          25,298        3,281        266       5,180      1,640 35,665    34,524
             of identifiable service
             charges
             Service charge income           732          811           -        26        365     1,934    1,717


             Government grants               251            -           -          -          -     251      310
             taken to income


             Turnover from social         26,281        4,092        266      5,206       2,005  37,850   36,551
             housing lettings


             Expenditure
             Management and other          6,157          827         43       1,130        755    8,912   7,415
             operating expenses

             Service charge costs           1,315        806          16         93         135   2,365    2,204


             Routine maintenance           2,678         539          24        373          34   3,648    3,032


             Planned maintenance           1,352        1,064         30       1,019         30   3,495    3,382


             Bad debts                       149           20          2          27         18     216     240
             Property lease charges            9            -           -          -          -       9        9


             Depreciation of housing       4,019         540          28        803        493    5,883    5,341
             properties
             Depreciation on Other           418           55          3          77         52     605     550
             Fixed Assets

             Operating expenditure        16,097        3,851        146       3,522       1,517  25,133  22,173
             on social housing
             lettings


             Operating surplus on         10,184          241        120       1,684        488   12,717  14,378
             social housing lettings


             Void losses                     221           97         14           1          7     340     462


            60   Annual Report and Accounts 2020


                                                                                                                 10/11/2020   13:35
       16645.02 HS Annual Report 86pp A4 v10.indd   60                                                           10/11/2020   13:35
       16645.02 HS Annual Report 86pp A4 v10.indd   60
   55   56   57   58   59   60   61   62   63   64   65