
Page 39 - Housing Solutions Annual Report
P. 39
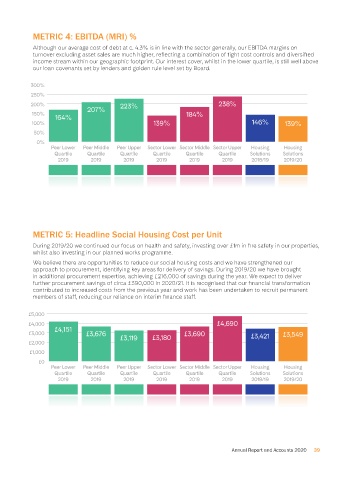
METRIC 4: EBITDA (MRI) %
                 Although our average cost of debt at c. 4.3% is in line with the sector generally, our EBITDA margins on
                 turnover excluding asset sales are much higher, reflecting a combination of tight cost controls and diversified
                 income stream within our geographic footprint. Our interest cover, whilst in the lower quartile, is still well above
                 our loan covenants set by lenders and golden rule level set by Board.


                300%
                250%
                200%                           223%                               238%
                                    207%
                150%                                                   184%
                        164%
                100%                                       139%                               146%       139%
                 50%
                  0%
                       Peer Lower  Peer Middle  Peer Upper  Sector Lower Sector Middle Sector Upper  Housing   Housing
                        Quartile    Quartile   Quartile    Quartile   Quartile    Quartile   Solutions  Solutions
                          2019       2019        2019       2019        2019       2019      2018/19     2019/20


                 METRIC 5: Headline Social Housing Cost per Unit

                 During 2019/20 we continued our focus on health and safety, investing over £1m in fire safety in our properties,
                 whilst also investing in our planned works programme.
                 We believe there are opportunities to reduce our social housing costs and we have strengthened our
                 approach to procurement, identifying key areas for delivery of savings. During 2019/20 we have brought
                 in additional procurement expertise, achieving £216,000 of savings during the year. We expect to deliver
                 further procurement savings of circa £390,000 in 2020/21. It is recognised that our financial transformation
                 contributed to increased costs from the previous year and work has been undertaken to recruit permanent
                 members of staff, reducing our reliance on interim finance staff.


               £5,000
               £4,000                                                            £4,690
                        £4,151
               £3,000              £3,676      £3,119      £3,180     £3,690                 £3,421     £3,549
               £2,000
                £1,000
                   £0
                       Peer Lower  Peer Middle  Peer Upper  Sector Lower Sector Middle Sector Upper  Housing   Housing
                        Quartile    Quartile   Quartile    Quartile   Quartile    Quartile   Solutions  Solutions
                          2019       2019        2019       2019        2019       2019      2018/19     2019/20


                                                                                       Annual Report and Accounts 2020  39


                                                                                                                 10/11/2020   13:35
       16645.02 HS Annual Report 86pp A4 v10.indd   39                                                           10/11/2020   13:35
       16645.02 HS Annual Report 86pp A4 v10.indd   39