Page 37 - Housing Solutions Annual Report
P. 37

The Regulator’s Value for Money metrics


                The regulatory framework published by the Regulator of Social Housing includes specific requirements for
                registered providers to publish evidence in the statutory accounts to enable stakeholders to understand the
                provider’s:
                    1.     Performance against its own value for money targets and any metrics set out by the regulator,
                       and how that performance compares to peers.
                    2.    Measurable plans to address any areas of underperformance, including clearly stating areas
                       where improvements would not be appropriate and the rationale for this.
                    Our performance against each of the metrics and our peers are set out below:

                       Regulator of Social Housing Value               Housing         Peer Middle     Sector Middle
                       for Money Metrics                              Solutions         Quartile         Quartile
                                                                       2019/20          2018/19          2018/19

                   1   Reinvestment %                                  5.00%             6.48%            6.20%

                  2a   New Supply Delivered (Social Housing Units)     3.50%             1.94%            1.50%

                   3   Gearing %                                       55.66%           52.60%           43.40%

                   4   EBITDA MRI %                                   139.38%            207%             184%

                       Headline Social Housing Cost Per Unit (Excl.
                  5a                                                   £2,575              -                -
                       depreciation and planned maintenance)
                  5b   Headline Social Housing Cost Per Unit           £3,549           £3,676           £3,690

                  6a   Operating Margin % (SHL only)                   33.60%           34.90%           29.20%

                  6b   Operating Margin % (overall)                    33.78%           31.10%           25.80%
                   7   ROCE %                                          2.64%            8.00%             3.80%


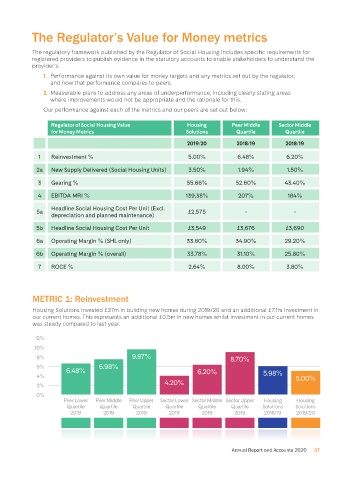
                 METRIC 1: Reinvestment

                 Housing Solutions invested £27m in building new homes during 2019/20 and an additional £7.1m investment in
                 our current homes. This represents an additional £0.5m in new homes whilst investment in our current homes
                 was steady compared to last year.

                 12%
                 10%
                  8%                               9.87%                              8.70%
                  6%                    6.98%
                            6.48%                                         6.20%                  5.98%
                  4%                                                                                         5.00%
                                                               4.20%
                  2%
                  0%
                            Peer Lower  Peer Middle  Peer Upper  Sector Lower Sector Middle Sector Upper  Housing   Housing
                             Quartile   Quartile    Quartile   Quartile    Quartile   Quartile   Solutions   Solutions
                              2019       2019        2019       2019        2019       2019       2018/19    2019/20


                                                                                       Annual Report and Accounts 2020  37


                                                                                                                 10/11/2020   13:35
       16645.02 HS Annual Report 86pp A4 v10.indd   37                                                           10/11/2020   13:35
       16645.02 HS Annual Report 86pp A4 v10.indd   37
   32   33   34   35   36   37   38   39   40   41   42